EDB PostgreSQL Advanced Server Performance
The world's most advanced open-source database

EnterpriseDB, for you and your institution to be able to use PostgreSQL databases and migrate your data to PostgreSQL:; specialized tools for advanced features such as data protection, backup, performance improvement, and disaster management provides.
Only a selection of the prominent PAS Performance improvements are covered here.
Query Optimization Tips
Query Optimizer Hints It allows software developers to contribute to how the internal SQL Optimizer behaves during optimization. This is because, in some cases, the software developer knows the data structure, but the SQL Optimizer does not. For example, a developer might know that a particular index is more selective for that query.
There are many tips for running and optimizing queries with a plan that suits the software's needs. A query can be directed to execute with a specific plan to quickly retrieve certain rows, or optimized to use a specific join.
Query Optimization Tips additional flexibility for software developers and additional control power during query execution by ensuring that the application always to achieve a consistent and stable performance provides.
Query Hint |
Description |
|---|---|
ALL_ROWS |
Optimized to retrieve all rows from the result set |
CHOOSE |
Default state. Contains no optimization to retrieve a specific amount of rows from the result set. |
FIRST_ROWS |
Optimized to return the first row from the result set |
FIRST_ROWS_10 |
Optimized to return the first 10 rows from the result set |
FIRST_ROWS_100 |
Optimized to retrieve the first 100 rows from the result set |
FIRST_ROWS_1000 |
Optimized to return the first 1000 rows from the result set |
FIRST_ROWS(n) |
Optimized to retrieve the first [n] rows from the result set |
FULL(table) |
Performs a sequential full table scan |
INDEX(table[ index] […]) |
It uses the [index] in the table to access the relationship. |
NO_INDEX(table [ index] […]) |
It does not use the [index] in the table to access the relationship. |
USE_HASH(table […]) |
It uses a hash created by using the join attributes of the table. |
NO_USE_HASH(table […]) |
It does not use a hash created by using the join attributes of its table. |
USE_MERGE(table […]) |
Uses merged sorting for join table |
NO_USE_MERGE(table […]) |
The join table does not use a combined sort. |
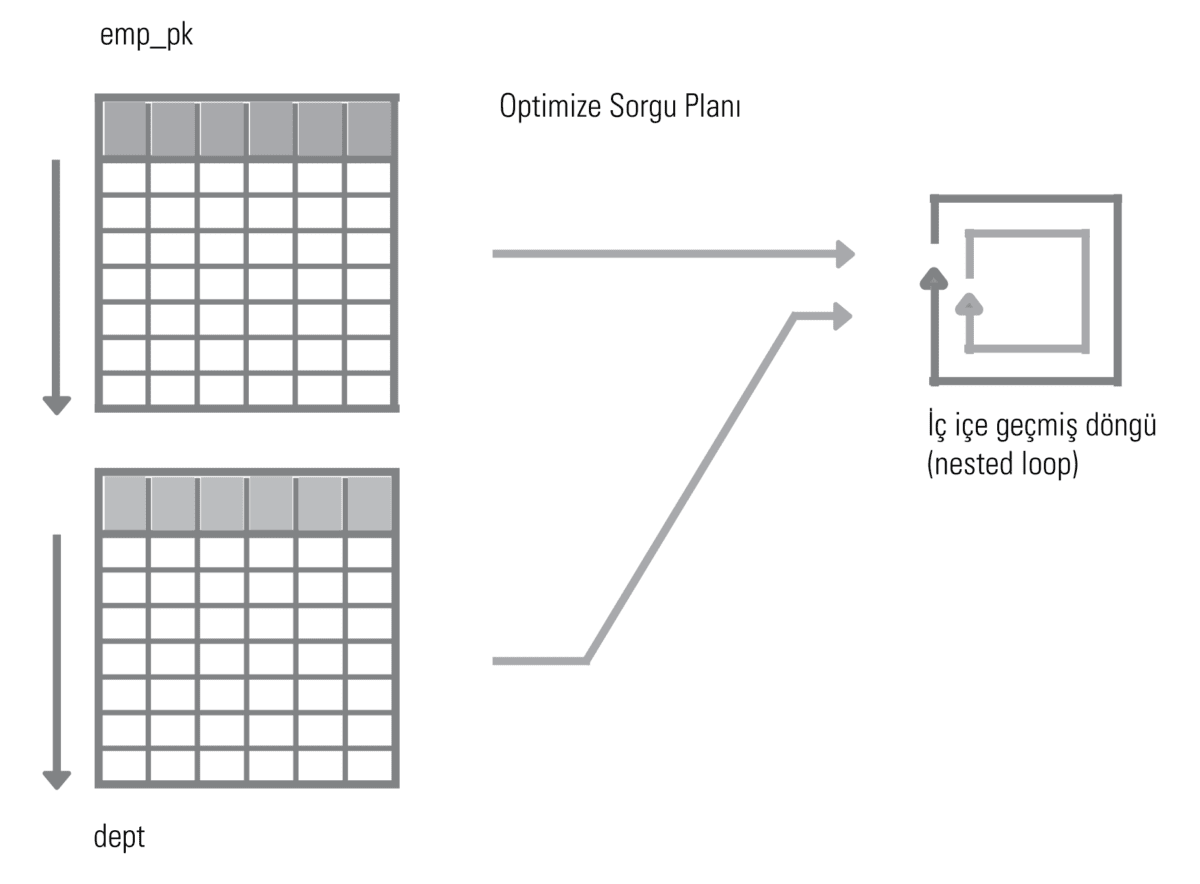
USE_NL(table […]) |
It uses a nested loop for the table |
NO_USE_NL(table […]) |
It does not use a nested loop for the table |
Fast Data Transfer with EDB*Loader
EDB*Loader has performance-enhancing features when loading text files into a Postgres database.
The standard of PostgreSQL COPY command, but it has significant limitations that increase loading time. The first of these is the requirement that fixed-width files must first be converted into delimited (e.g., comma-separated) files.
“The other important limitation of the ”COPY" command is it is the lack of error control. When the “COPY” command is used, if a single line in the file is erroneous, the rest of the data cannot be transferred, which requires examining the file and correcting it again.
EDB*Loader writes these rows to a different file as discarded ones and ensures that only these lines are corrected and re-uploaded. The other lines are accepted into the system.
Direct Path, Parallel Execution and Append
On the other hand, the most important advantage provided by EDB*Loader is the “Direct Path” loading, which significantly increases loading performance. Direct Path loading allows bypassing certain operations that significantly affect and slow down bulk file processing performance, while also offering the user the option to execute all or rollback everything if there is an error.
The Direct Path load processes the input rows and parses them according to the column specifications provided in a control file. It then converts the parsed data into the column data types to build an internal data structure, which it ingests by converting directly into the Postgres data block format. Thanks to this processed data block written directly to the data directory, high ingestion performance is achieved.
Starting with version 9.0, EDB*Loader has been provided with the ability to simultaneously import data from multiple files into the same table, thereby achieving much greater gains in import performance. The parallel loading feature is now EDB Migration Vehicles have also been integrated into it, thereby ensuring that data migration processes are performed more quickly.
that you can use during imports with EDB*Loader Append thanks to the option, it does not even require the target table to be empty.
SQL Profiler
Postgres Advanced Server includes a SQL Profiler that comes within Postgres Enterprise Manager.
SQL Profiler examines the selected database and generates a report of the SQL commands coming in here. The query profile report is one of the greatest helpers for database experts in improving the performance of their systems or software.
Query profile reports can be used for two main purposes:
- Performance increase by identifying long-running queries and re-optimizing them
- Performance improvement through the detection and optimization of functions containing repeatedly executed SQL commands or time-consuming operations
Bulk SQL Operations
SQL queries that return huge result sets containing a high number of rows may not run in the most performant way possible. The reason for this is that between the database engine and the procedural language code, this they are the continuous context changes that occur during the transfer of result sets.
This inefficiency can be mitigated by streaming the result sets into memory and providing subsequent access to the client. Postgres Advanced Server's SPL stored procedure language, which we call, BULK COLLECT thanks to its feature allows large result sets to be collected in an in-memory collection.
by converting such PL/pgSQL functions that handle large cursors into SPL functions using BULK COLLECT Performance can be increased to 100% and above.
Directory Consultant
Another performance analysis tool included in Postgres Advanced Server Index Advisor Directory Consultant’is.
Index Advisor helps database experts and software developers, by analyzing one or more SQL statements more high-performance what needs to be created for data scanning recommendations regarding new indices is found. This contains more than one column compound indexes can also do for.
Index Advisor comes into play for all data modification (INSERT, UPDATE, DELETE) and SELECT statements.
The Index Advisor diagnostic report also includes the following information:
- Performance increases thanks to the newly created directories
- Size of the new directories
- Data Definition Language (DDL) to be used in the creation of new directories
Code Profiler
The code profiling process by executing one or more procedural database code snippets conducting a performance benchmark and during operation where and how much time was spent It is resolved.
Profiling usually seeks answers to the following questions:
- Which piece of code occupies the majority of the operating time?
- How many times is a loop being executed?
- Which coding approach is more performant in delivering the desired result?
Without profiling, answers to questions like the ones above are purely speculative. When database and software experts lack powerful tools, they generally use primitive profiling techniques such as inserting certain statements between code snippets and printing the response time. The reason we call these primitive is that such an approach is laborious, time-consuming, and error-prone. It is often like fishing: you cast the line and wait, and if there is no fish, you have to cast your line somewhere else. You will not experience these issues with Code Profiler.
Especially Oracle DBMS_PROFILER users Code Profiler They will feel very comfortable while using it.
To profile one or more stored procedures or functions, a database or software expert needs to briefly do the following:
- Running the profiler and giving it a session name:
EXEC dbms_profiler.start_profiler - Running the code to be profiled
- Stop profiling and analyze the statistical data:
EXEC dbms_profiler.stop_profiler;
diagnostic reports produced by the Code Profiler operating times, I/O information, pending events, operation counts, and much more helpful information includes.
DynaTune Dynamic Optimization
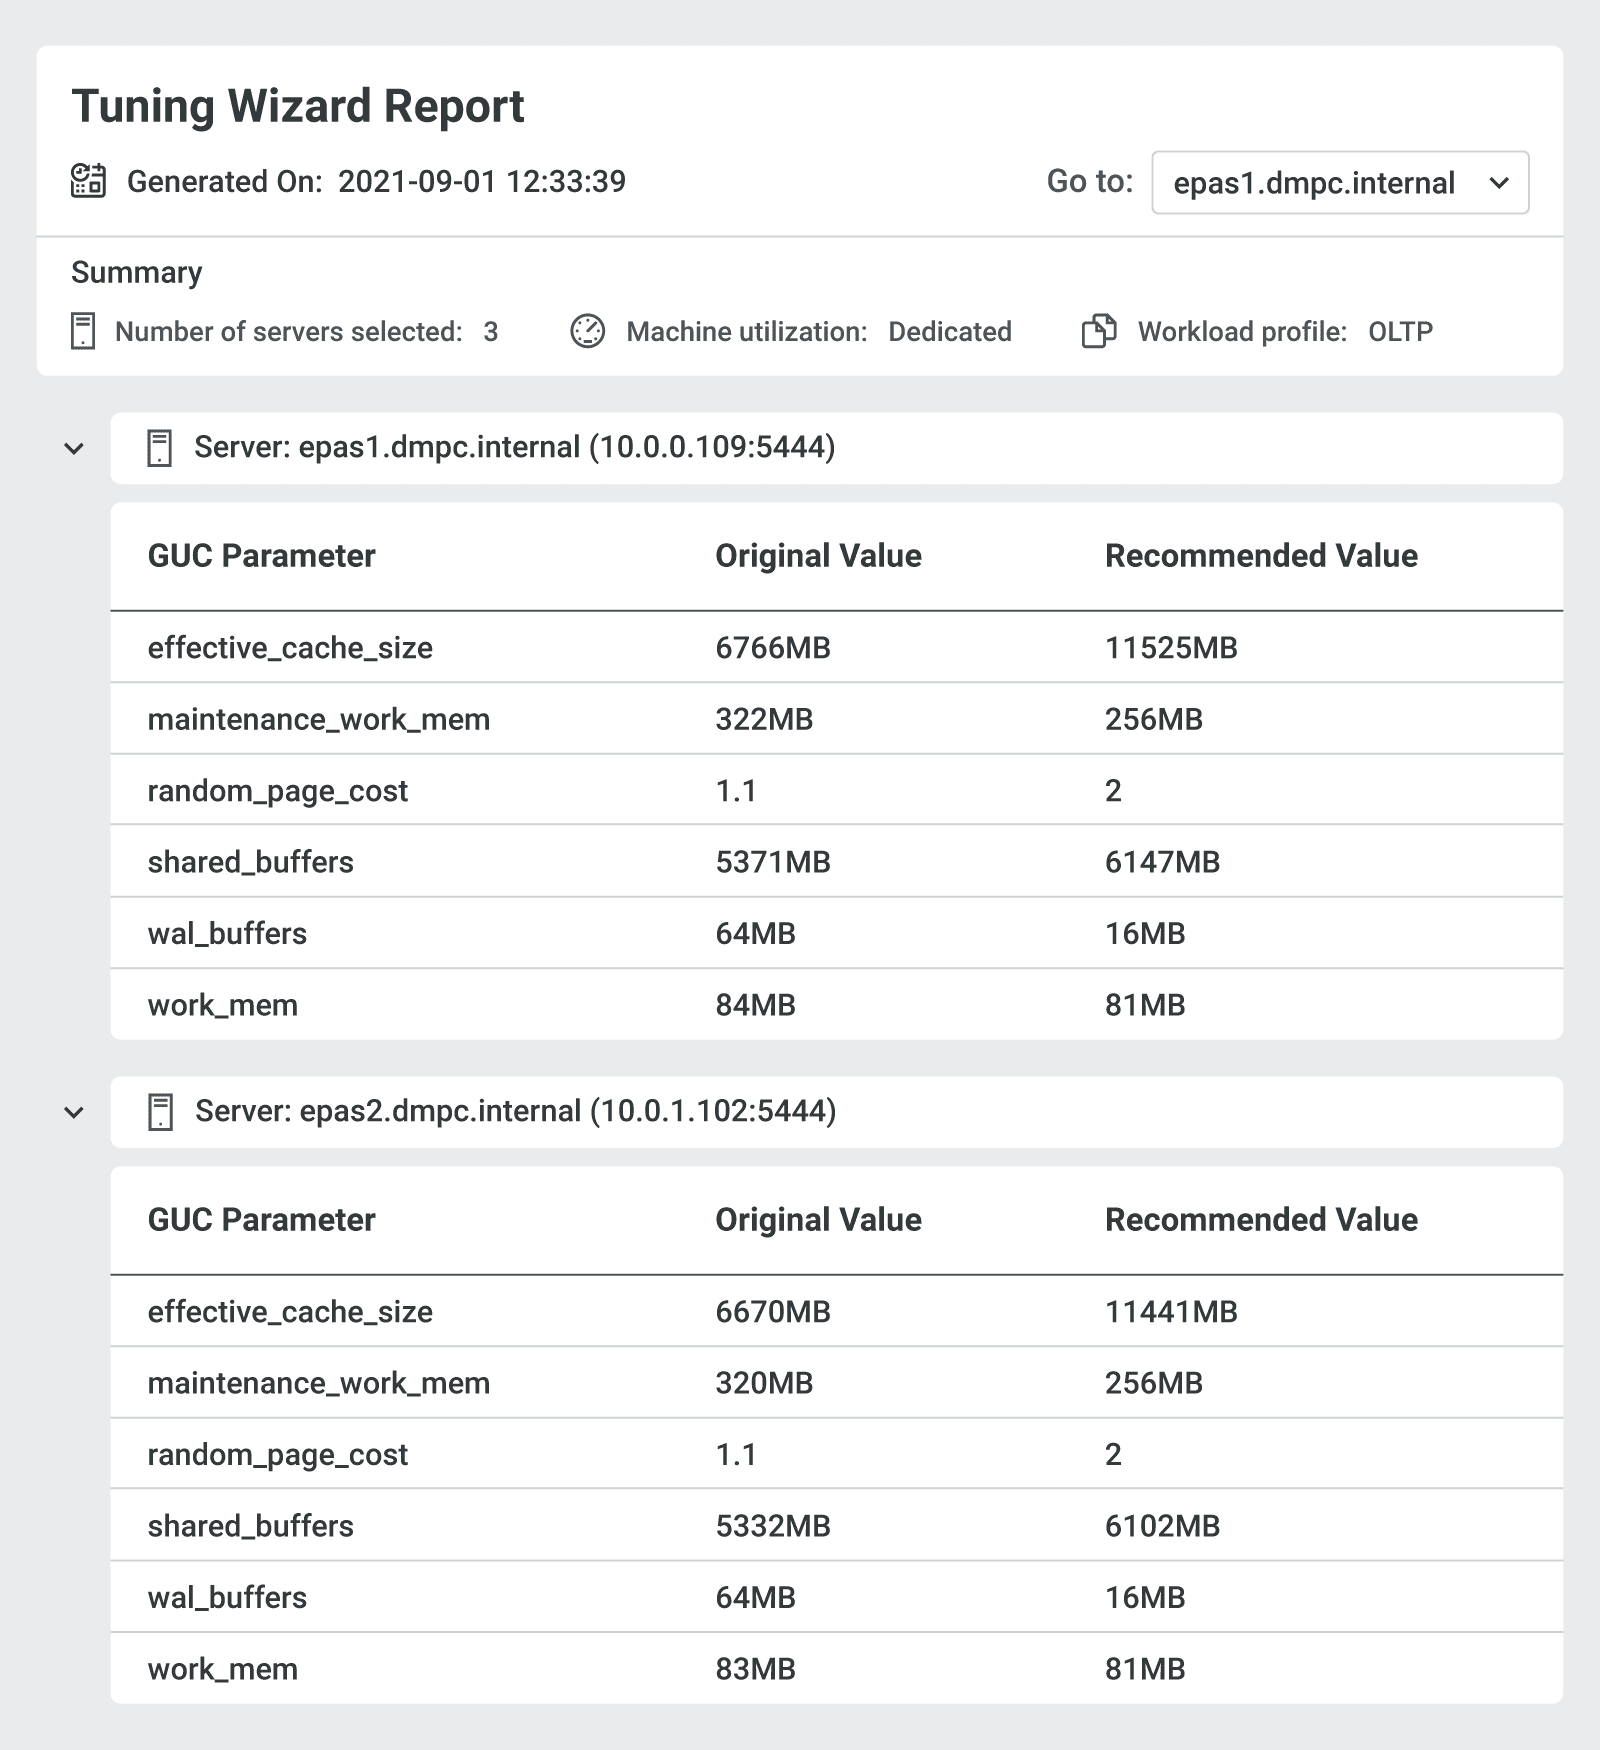
DynaTune is used to ensure the correct optimization of the database workload depending on the server hardware. It is the issue that DBAs struggle with the most simplifying performance optimization to the bare minimum helps you.
In the race for performance optimization, popular database applications operate with the mindset that “the more fine-tuning options you have, the better,” turning every system variable into a tuning knob. However, as a DBA, knowing all of this fine-tuning, learning when to use them, and most importantly, measuring the impact of each tweak can become a hair-pulling experience. For this reason, many database workloads continue to run under-optimized. Database experts and masters who train DBAs know that the best approach is to start with a core set of configurations that will yield the highest performance return first, and then move on to fine-tuning if necessary.
DynaTune, Postgres database of its optimization It eliminates uncertainties.
sophisticated, built based on the results of numerous tests conducted on a wide range of hardware and datasets, thanks to a smart algorithm it simplifies many database optimization settings into two basic sets based on the response to be received from the user.
With a few questions asked during installation, you get better-than-average performance optimization right from the start. Afterward, you can make finer optimization adjustments based on usage data. This simplifies a task that is as important as it is complex, preventing you from getting bogged down in settings by fiddling with tweaks that yield minor performance gains.
DynaTune, when you upgrade or replace hardware, for example, when you upgrade memory, automatically recalibrates current settings and ensures that the database workload utilizes the hardware in a manner consistent with the previous one.